
Chapter 3 | Exporting Diagrams and Videos

Offline versus Real-time Rendering
Moving into the production phase requires a decision between real-time or offline rendering, balancing quality with speed. The Lightspeed Realtime Render Engine (TM) in “Smooth + Texture” mode [Ctrl+7] is expected to suffice for many projects. Yet, for specific cases, “Direct Light” or “Skylight” modes may be preferable. These modes enhance textures, shadows, reflections, and anti-aliasing, offering a polished look but require more time, especially for videos. Sometimes, no significant difference is observed between these modes and the current one. Before finalizing your visuals, assess which rendering mode best suits your project's needs. Rendering is discussed in more detail in Chapter 5.
Exporting to Static Images and Diagrams
Project > Export
The easiest way to export diagrams is in image format. You can export your image in current, direct light, or skylight render modes. To export, go to Project > Export.
Use the file type drop down menu to select the preferred image format, then press “Save”.
The resulting image will be saved at the resolution of your display device.
If the resolution of your display is too low to provide sufficient quality for your diagram, you can also export images through the tools > animation menu. To export a single image, enable the “use single frame” toggle. Typically, if you use static objects to generate your diagram (rather than snapshots from an animated sequence), you will want to set the frame number to 0 (or time = 0.0). Set the image size using the “size” drop down menu. Use the “render method” to select “direct light” or “skylight” for the highest quality productions using the “offline” render engine (skylight gives the best results). If you select direct light or skylight, you will also need to set the “supersamples” value. The quality of the render improves with higher supersample values but will take longer to finish. If you wish to use the Lightspeed Realtime Render Engine, which is significantly faster, simply leave the render method as “current” and set your view mode to “Smooth + Texture” [Ctrl+7]. Finally, left-click “create”, select the preferred image file type from the drop down menu (note the default file type is .avi), and press “Save”.
Ultra-High Res Diagrams
When “use single frame” is enabled AND render method is set to current, a check box for “custom size” will become available for selection. Once this is enabled, you can then set the pixel height and width for your render. In the initial release, these are limited to about 25k by 25k. This feature is primarily intended to help create scale diagrams for extremely large scenes (from top-down view), but can also be used to generate perspective view images.

Using the Print Template Tool
Another option for creating scale diagrams is to use the Print Template tool. With the Print Template Tool, it’s extremely easy to create scale diagrams with a standardized format that’s best for your organization. The Print Template Tool is designed to make it easier for you to create physical scale diagrams from your Virtual CRASH project.
RECOMMENDED WORKFLOW
First, in a blank project, go to Create > Helpers 2D > Print Template. Left-click “Print Template” and left-click in the project. As usual, right-click to terminate the command.
Now you’ll see the Print Template Tool in the workspace.
The red outline represents the boundary of the physical paper on which the diagram will be printed. The paper size can be modified using the “size” dropdown menu in the “paper” menu. Use the “landscape” toggle to switch between portrait and landscape. The diagram’s scale can be specified using the “scale” dropdown menu. Use the “left”, “top”, “right”, “bottom” input fields in the “margins” menu to set the margins of the diagram.
Switch to “Select, Move and Manipulate” cursor control type, then select “Guidelines” in the object selection type dropdown.
Left-click on one of the “+” symbols, hold, and drag your mouse left or right (or up and down), to create a guideline. Each guideline will be shown in the list in the “guideline” menu in the left-side control panel. As shown above, using the upper “+” symbol defines a guideline from the upper edge of the page. This is also indicated by the “from: top” option in the “guideline” menu. The distance from the upper page edge and the guideline is controlled by the “distance” value (note, the distance is the physical distance on the page relative to the margin). This can be specified by keyboard entry or by using the control grip. Note, after the guideline is created, you can modify its position interactively by left-clicking on the red guideline, holding, and dragging the mouse cursor (you must be in “Guidelines” mouse cursor control type).
Here we’ve created six guidelines to create various zones in our print template. Each zone, defined by the page boundary and the various guidelines, can have a different element inserted into it. Note, we’ve placed the Print Template Tool at position-local (x,y) = (0,0) and modified our grid lines to make it easier to adjust the layout.
With the Print Template Tool actively selected, switch to “Elements” selection type and open the “element” menu in the left-side control panel. “Left-click, hold, the “+” symbol that appears when you hover over the intersection point made between two guidelines (or page boundary and guideline). Next, drag to diagonally to a second intersection point made by two guidelines (or page boundary and guideline). The rectangular area defined by these two opposite corner points defines a zone within which you can place an “element” (text, image, north arrow, or scale indicator).
This zone will be highlighted red once created, and you’ll see its name appear in the “element” menu.
Scrolling down the left-side control panel, you’ll find additional options for the element’s zone. For example, the guideline indices, which specify which guidelines are being used to define the element’s zone are specified (note, the index counts from left to right for left and right boundaries and up to down for the top and bottom boundaries). Each zone can have additional padding specified and well as a border. Note, when multiple zones are defined, each one can be selected interactively by left-clicking inside the given zone while in “Elements” selection type.
The type of element to appear in the zone can by specified by the “type” dropdown. Here we specify an image to be used for element 1. In this case, an image element can be loaded using either the “texture” button or by dragging and dropping an image into the image element’s zone. Note, if the “background” toggle is enabled, the zone will have a white fill color behind the element; otherwise, the background will be transparent.
Next, we insert our second element, which will be “type:compass”. This type is also an image format, but the image will always stay aligned with the global y-axis, even if rotation-local yaw of the Print Template Tool is non-zero. In this case, our north arrow image came from the assets browser (assets > other 2d > north arrows). Simply drag and drop the north arrow graphic into its zone.
Next, we insert additional guidelines in order to define a small zone in the bottom right to inject our third element of type scale. Note, elements with “type: scale” have text attributes, such as font, bold, italic, and size, which can be modified as needed.
Next, we insert another guideline and text element. Elements of type text have a “text” input field, where you can type any text you wish. Here we simply add “Scale” to appear next to the scale element. Remember, you can switch back to “guideline” selection type and dynamically modify the placement of each guideline as needed. The corresponding elements within each zone will adjust in size and placement as you modify your guidelines.
Finally, we place an additional text element at the center-bottom of the page, and we place another large element across the full diagram in order to define a black border around the full diagram.
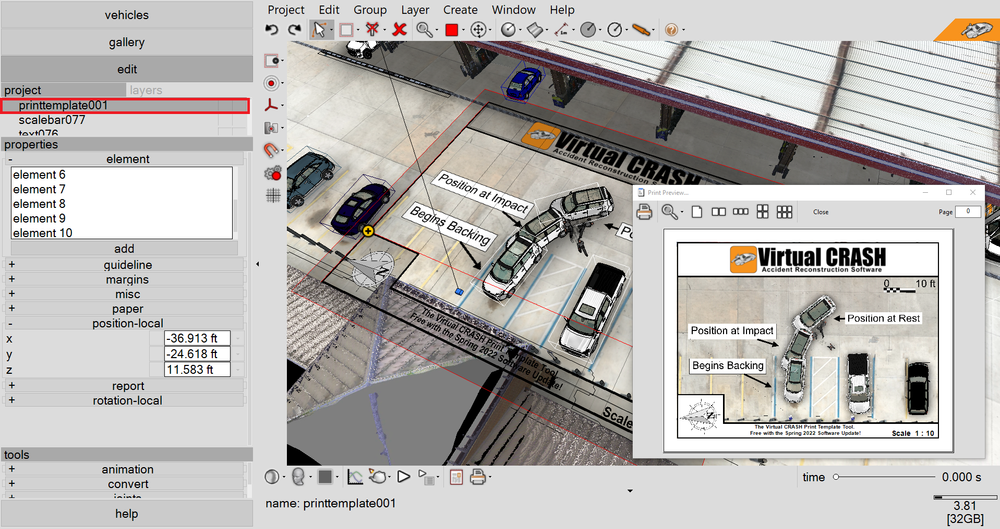
Left-click on the Print Template Tool in the left-side control panel. Next, go to the print icon and select “Print Preview” to see a preview of the template.

Finally, we save this template as a .vc6 file.
Next, open your subject case project. Go to Project > Import and open your print template Virtual CRASH file (you can also simply drag and drop the file from the Windows file explorer).
Here we see the Print Template Tool in our scene. Note, the yaw value of the Print Template’s rotation-local menu is set to the yaw value of the text objects and scale bar in our scene. This ensures that our text boxes are printed along a horizontal line within our scale diagram.
Once imported into the scene, you are free to make whatever additional changes you wish. To preview the resulting scale diagram, first ensure that the Print Template Tool is selected in the project menu (or layers menu). Next, go to the Print menu, and select “Print Preview”. When simply previewing the diagram layout, it is recommended to use “Render – Current” to avoid ray tracing in Direct Light or Skylight, which can take more time to complete.
Note, the Print Template Tool always renders from the top-down orthographic view no matter what the view setting is in your interactive workspace window.
Once you are satisfied with the layout of your diagram, it is recommended to create the final version in Direct Light or Skylight render mode for the highest quality. You can increase the quality using the “Print DPI” setting. Note, by lowering “Print Preview DPI”, you can speed up the production of print previews in Current, Direct Light, and Skylight mode.
Here we see a Print Preview in Skylight at the maximum “Print Preview DPI” setting (note 0 = maximum value).
To print without previewing, select “Print”. When using the Print button, do not forget to ensure the Print Template object is selected in the project or layers menu, otherwise the printout will not be of the template’s view.
Here we see our final diagram in pdf format.
Note, you can clone a Print Template like any other object. This allows you to create multiple diagrams with a standardized format for many different areas within your project.
Using the Print Menu
Another option to create diagrams is to use the Print menu (see below). By going to the properties > render (deselect all objects to see this menu), you can enable a border and some label options. Left-click the printer icon and set the scale for your printout, render type (current, direct light, or skylight), and “Print DPI” (this is supersamples - set to 0 for maximum quality). Use the “Page Setup” menu to select the physical paper size.
Below we see the resulting print preview.
Exporting to Videos
Creating videos of animated motion can be accomplished using the tools > animation menu. Select the size, render method, supersamples, and codec (see below). You can also render to various playback speeds using the “speed” drop down menu. Once you selected the various settings, left-click “create”, enter the file name, and press “Save”. The video will render to .avi file format and should play in most video players on Windows once completed.
Reducing Pixel Flicker from Emissive Lighting with Supersamples
If you are using the Lightspeed Realtime Render Engine (render method: current in "Smooth + Texture") to generate your videos and are utilizing emissive lighting, you might notice a pixel flicker or strobe effect in certain parts of your video. This effect may be pronounced for light assemblies far from the camera, where the illuminated components cover only a few pixels on the screen.
Users have the option to improve the quality of their Lightspeed Realtime Render Engine videos (GPU-based renders) by choosing between 1x, 4x, 9x, and 16x supersamples when using “render method: current”. Available supersamples options will depend on the “size” option. Increasing supersamples for GPU-based renders will improve video quality by antialiasing. This will reduce “jaggies” (learn more) and pixel flicker or strobing when emissive lighting is used. Note, the default supersamples size for “render method: current” will be 9x, 4x, or 1x depending on what “size” option is selected. Similar to direct light and skylight rendering, increasing the number of supersamples beyond 1x improves quality but results in longer render times per frame. Users can balance render times against the desired quality to suit their needs.
Below, we see the striking difference between the video on the right, rendered with “render method: current”, at 1920HD, and at 1x supersamples (left) versus the same video rendered at 16x supersamples (right). Note the significant reduction in emissive lighting flicker. As the video continues, a comparison of the smoothness of the boundary between the vehicle in the foreground versus the background is shown by zooming in on the video. This reduction jaggies is also evident in the headlight ground illumination. Again, the difference is striking between 1x and 16x.
Tags: How to print frames, how to print, printing, preview, scale diagrams, creating videos, make video.
© 2024 Virtual CRASH, LLC. All Rights Reserved